Request Management
Resolve requests automatically with complete operational context
.png)
.png)
Trusted by the best

.svg)
.svg)
.svg)


60% automated resolution
"We grew from 120 to 350 employees without adding IT headcount. Siit handles password resets, software access, and hardware swaps automatically. Our team focuses on complex projects instead of repetitive tickets."
Jared Allenbrand, IT Director
How it works
Request arrives, context assembled, workflows execute, impact measured.
1
Submit request
Slack
Microsoft Teams
Email
Siit Portal

2
Unify data
+21
HRIS
MDM
IAM
+14
Ticketing

3
Execute workflows
App access workflow
Onboarding workflow
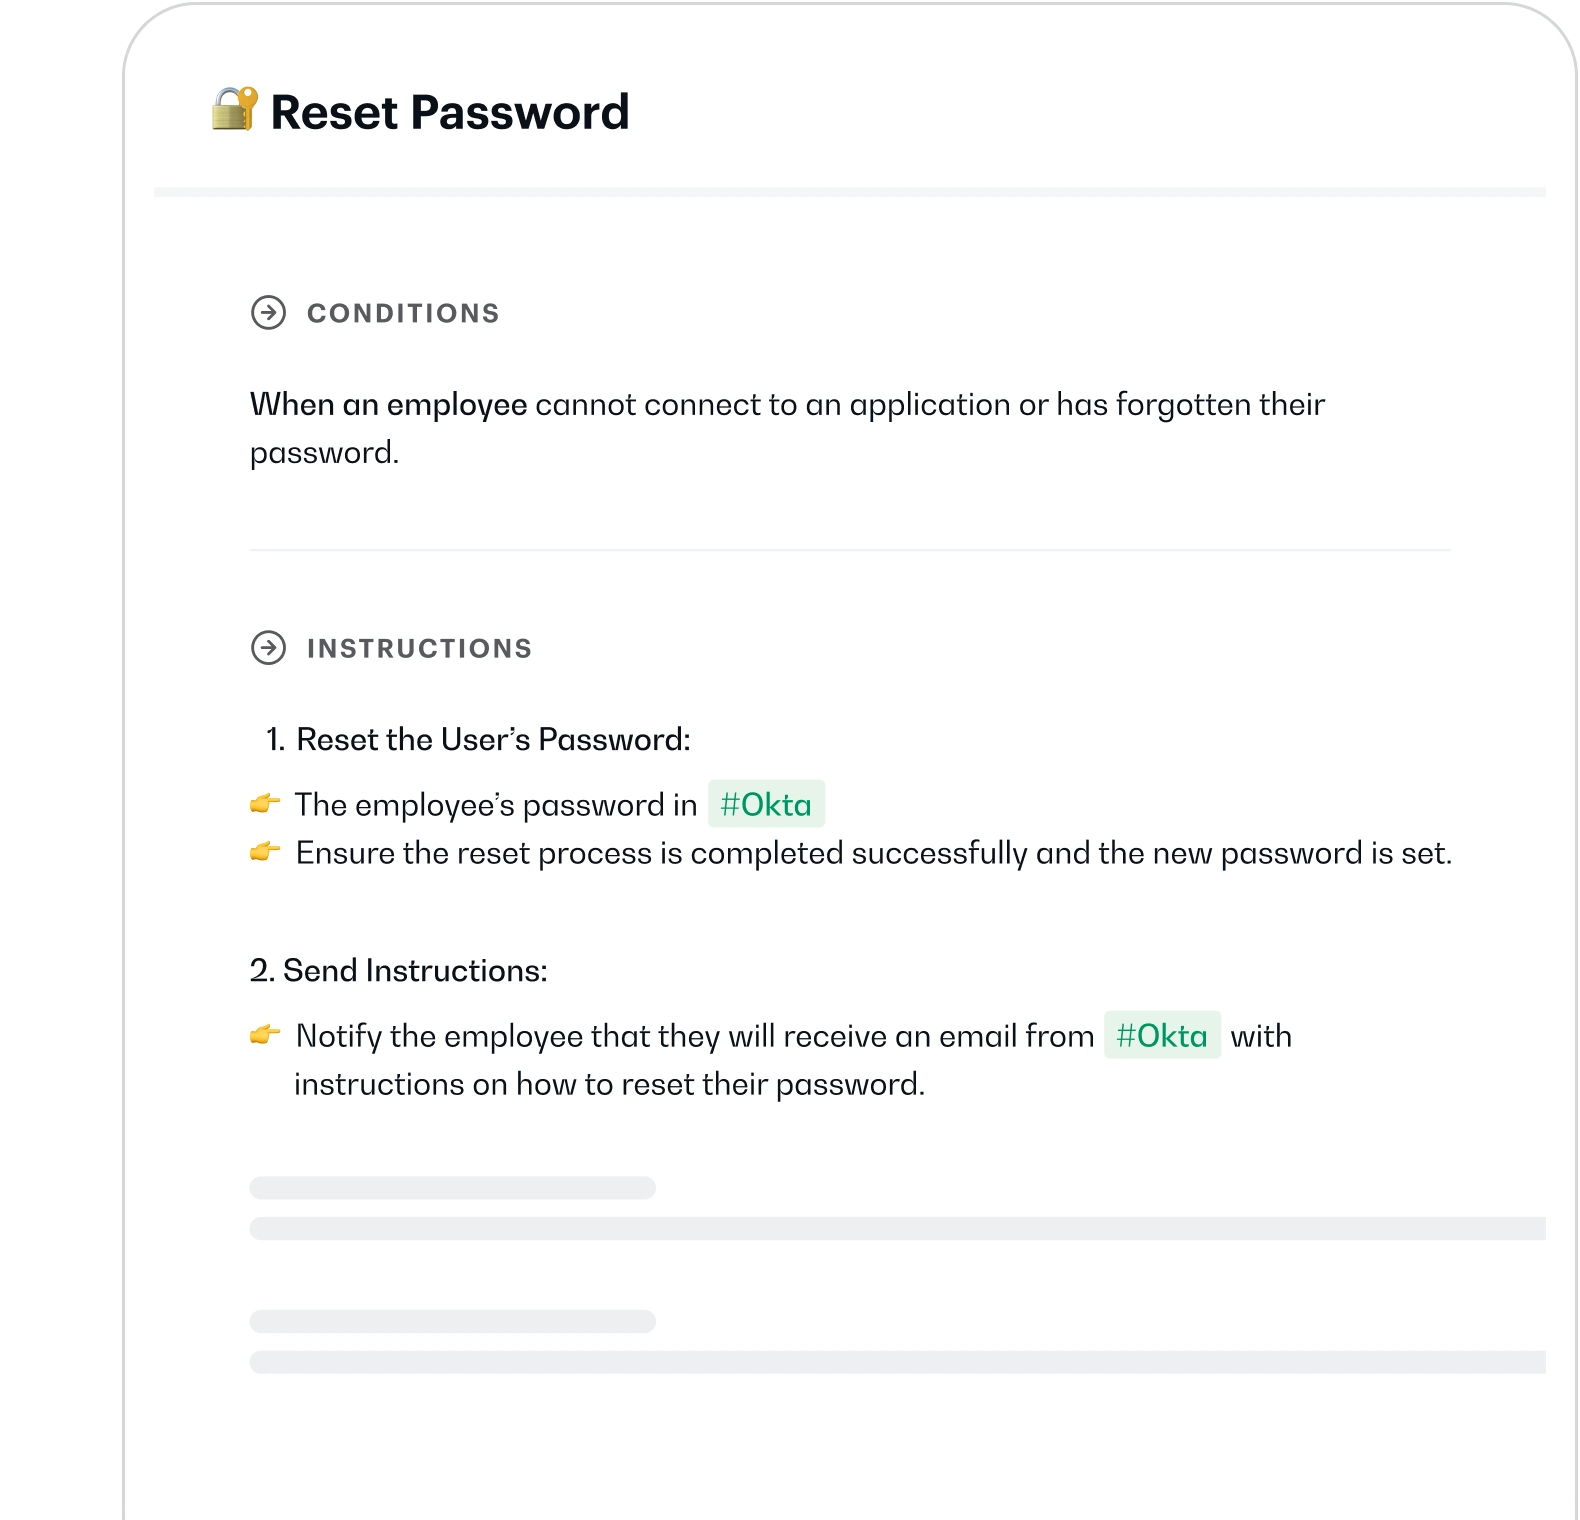
Password reset workflow
+ Customizable workflows
4
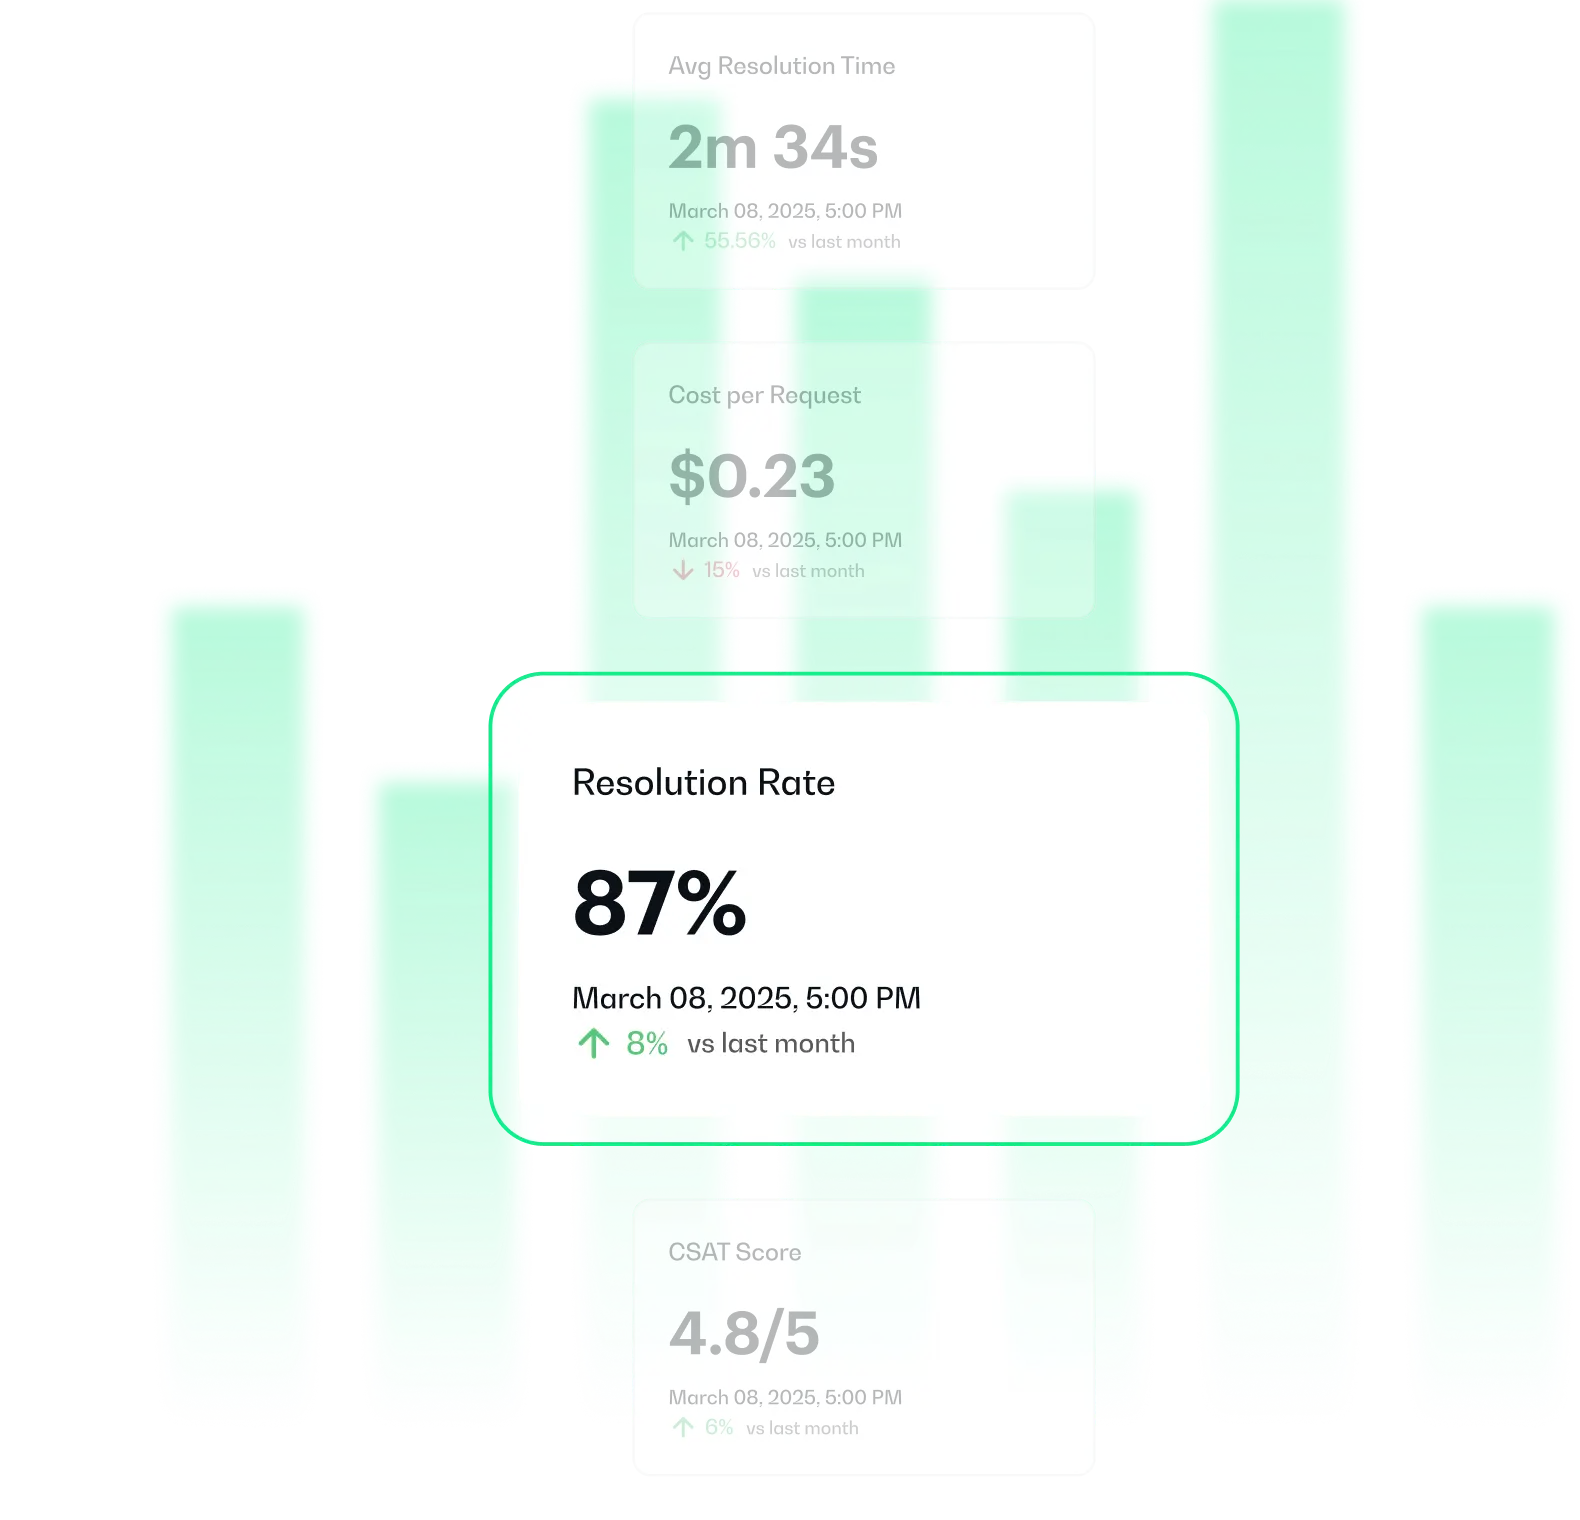
Measure impact
Dashboard Analytics
SLA Performance
Satisfaction Survey
+ Additional metrics and reports
Key Capabilities
.png)
Unified operational data
Every request includes employee role, manager, equipment, permissions, and history.
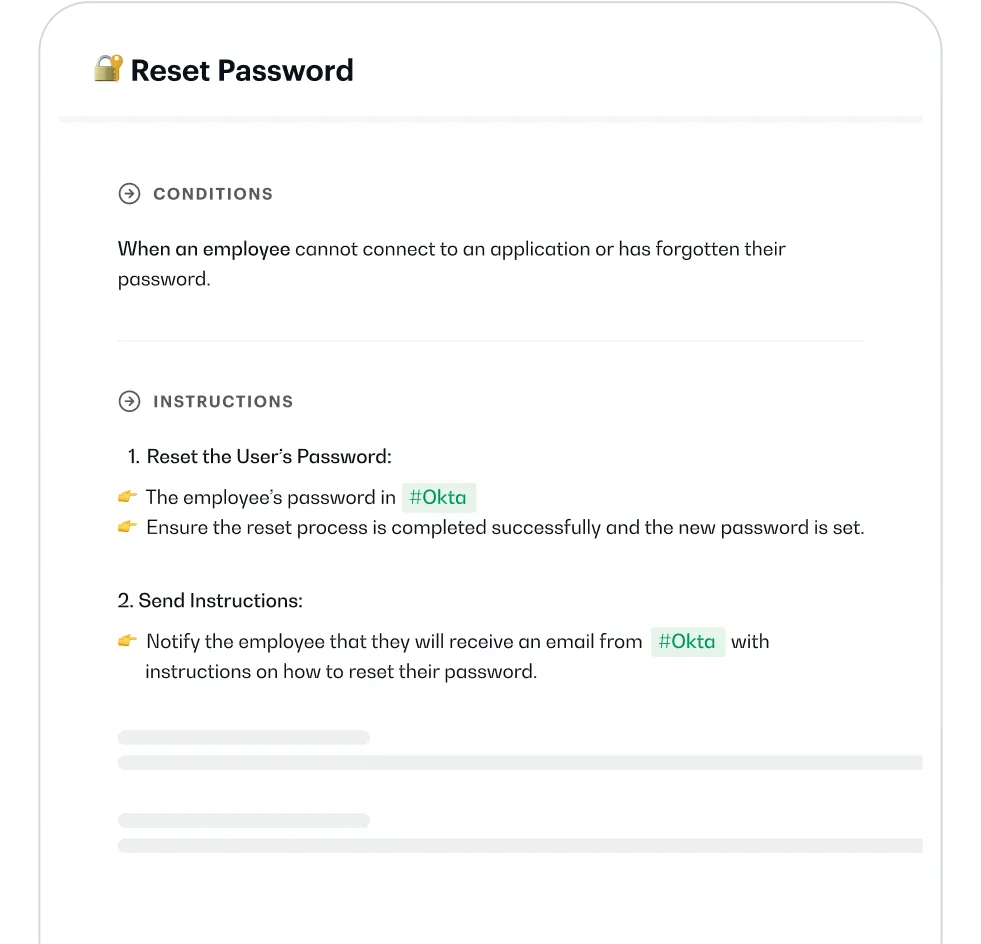
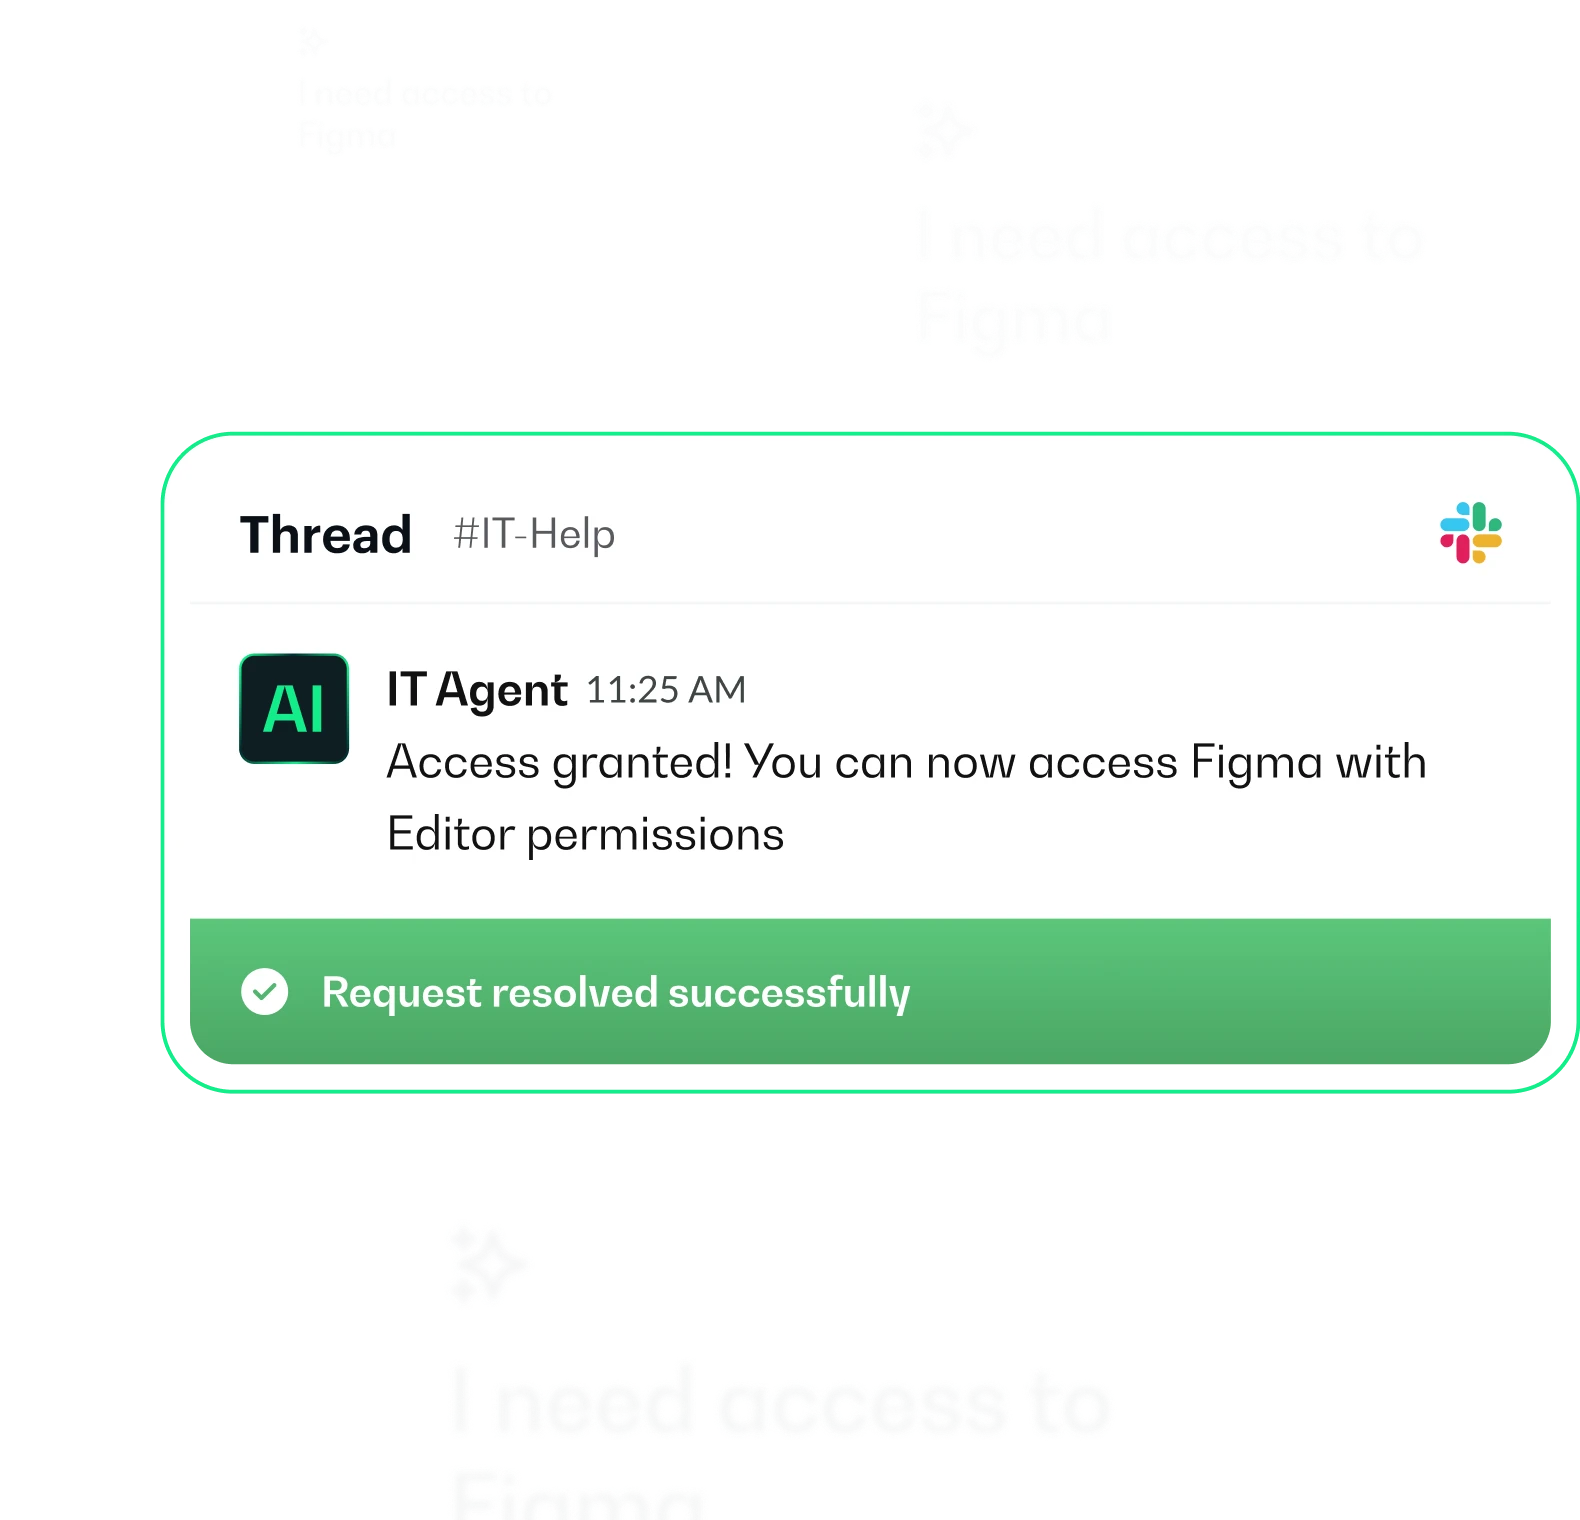
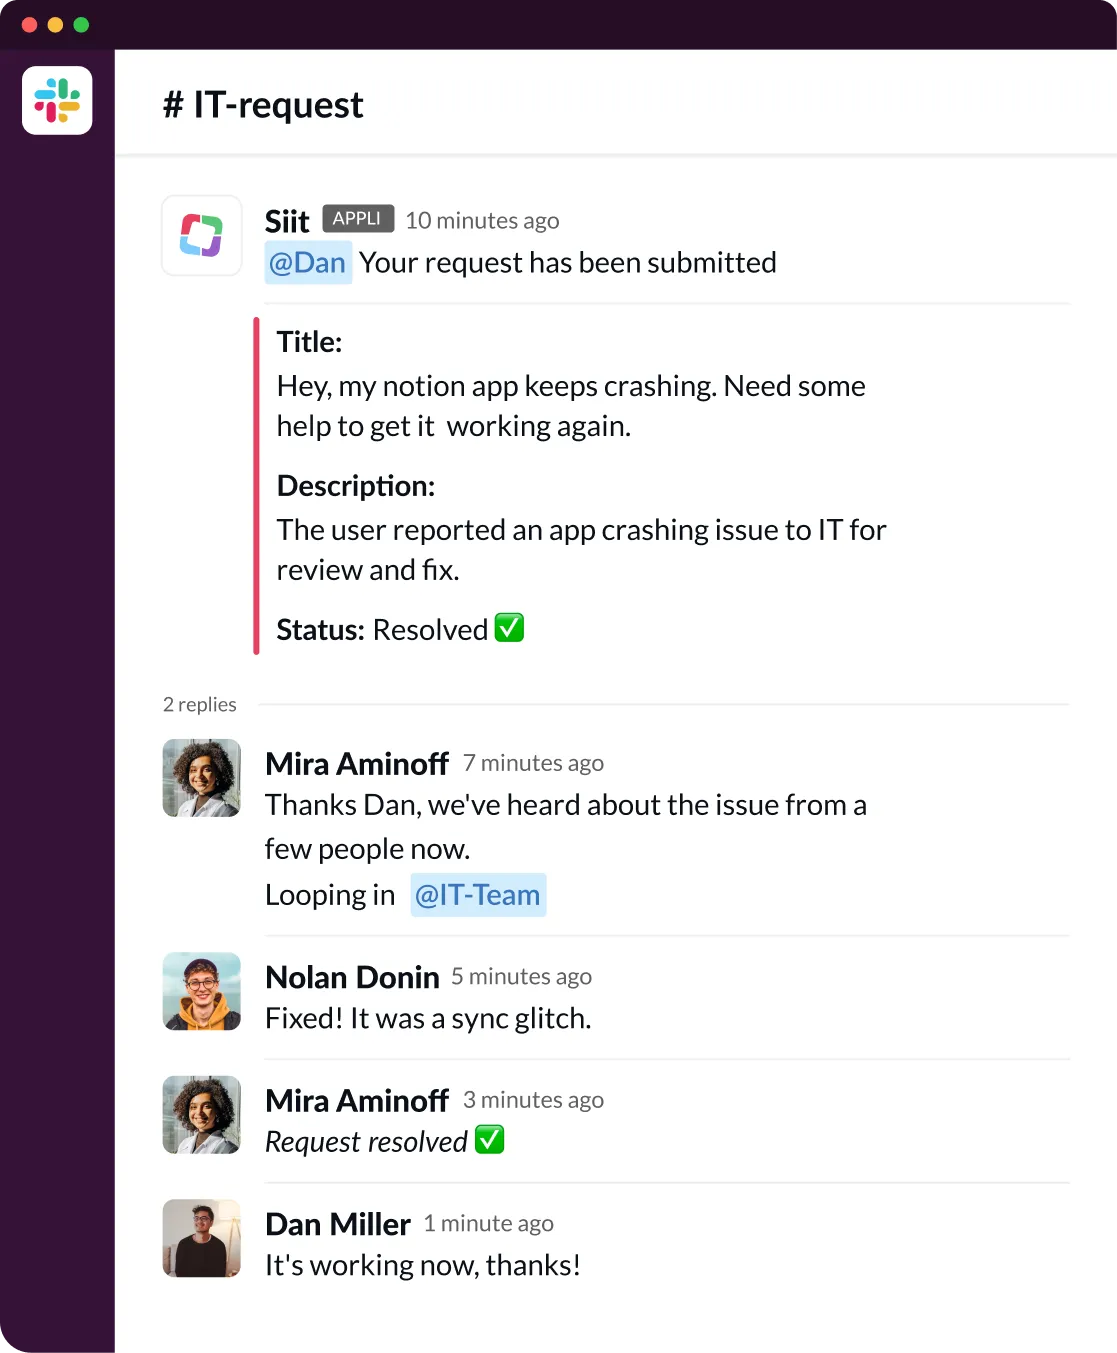
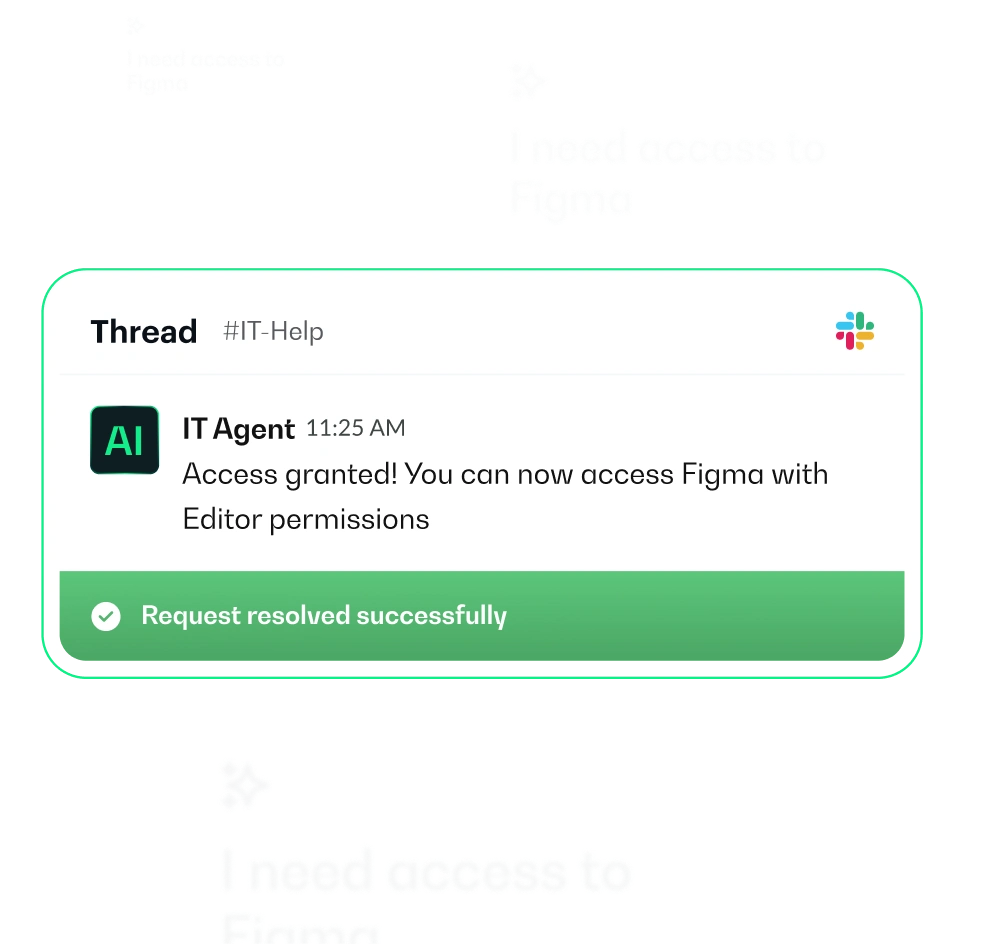
Automatic resolution
AI follows your playbooks to resolve requests—password resets in Active Directory,
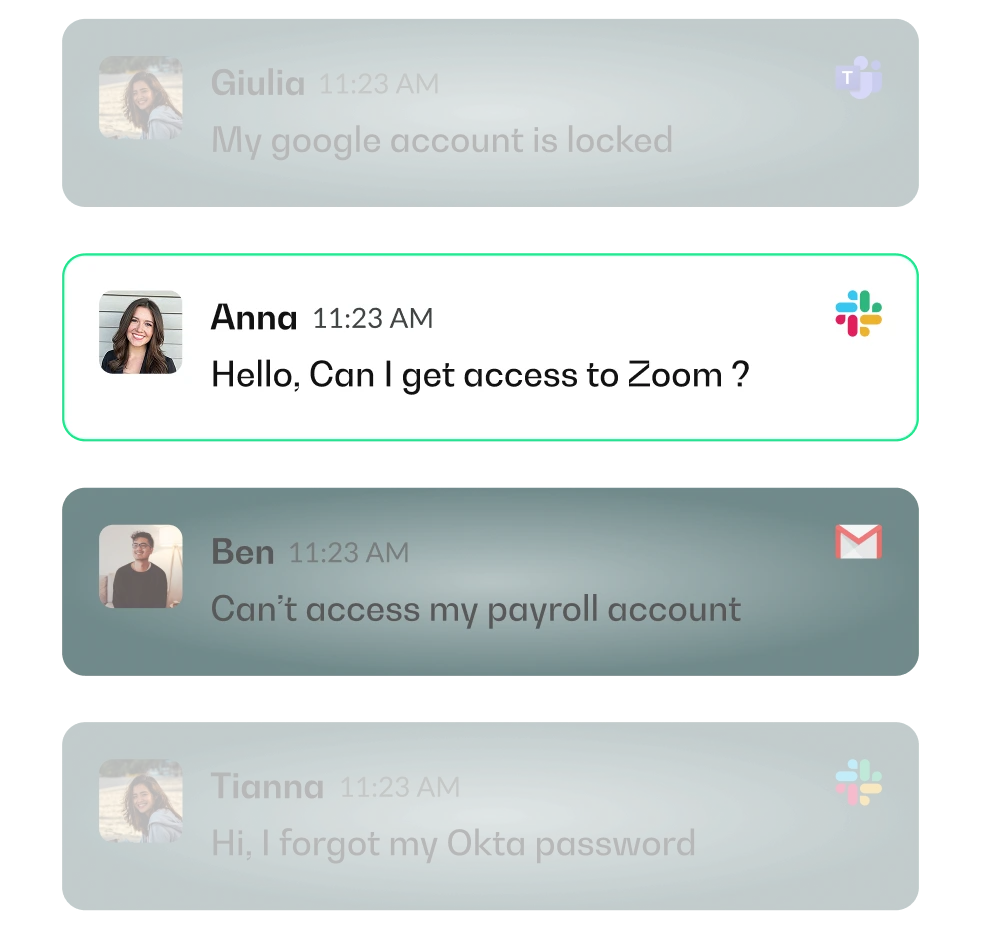
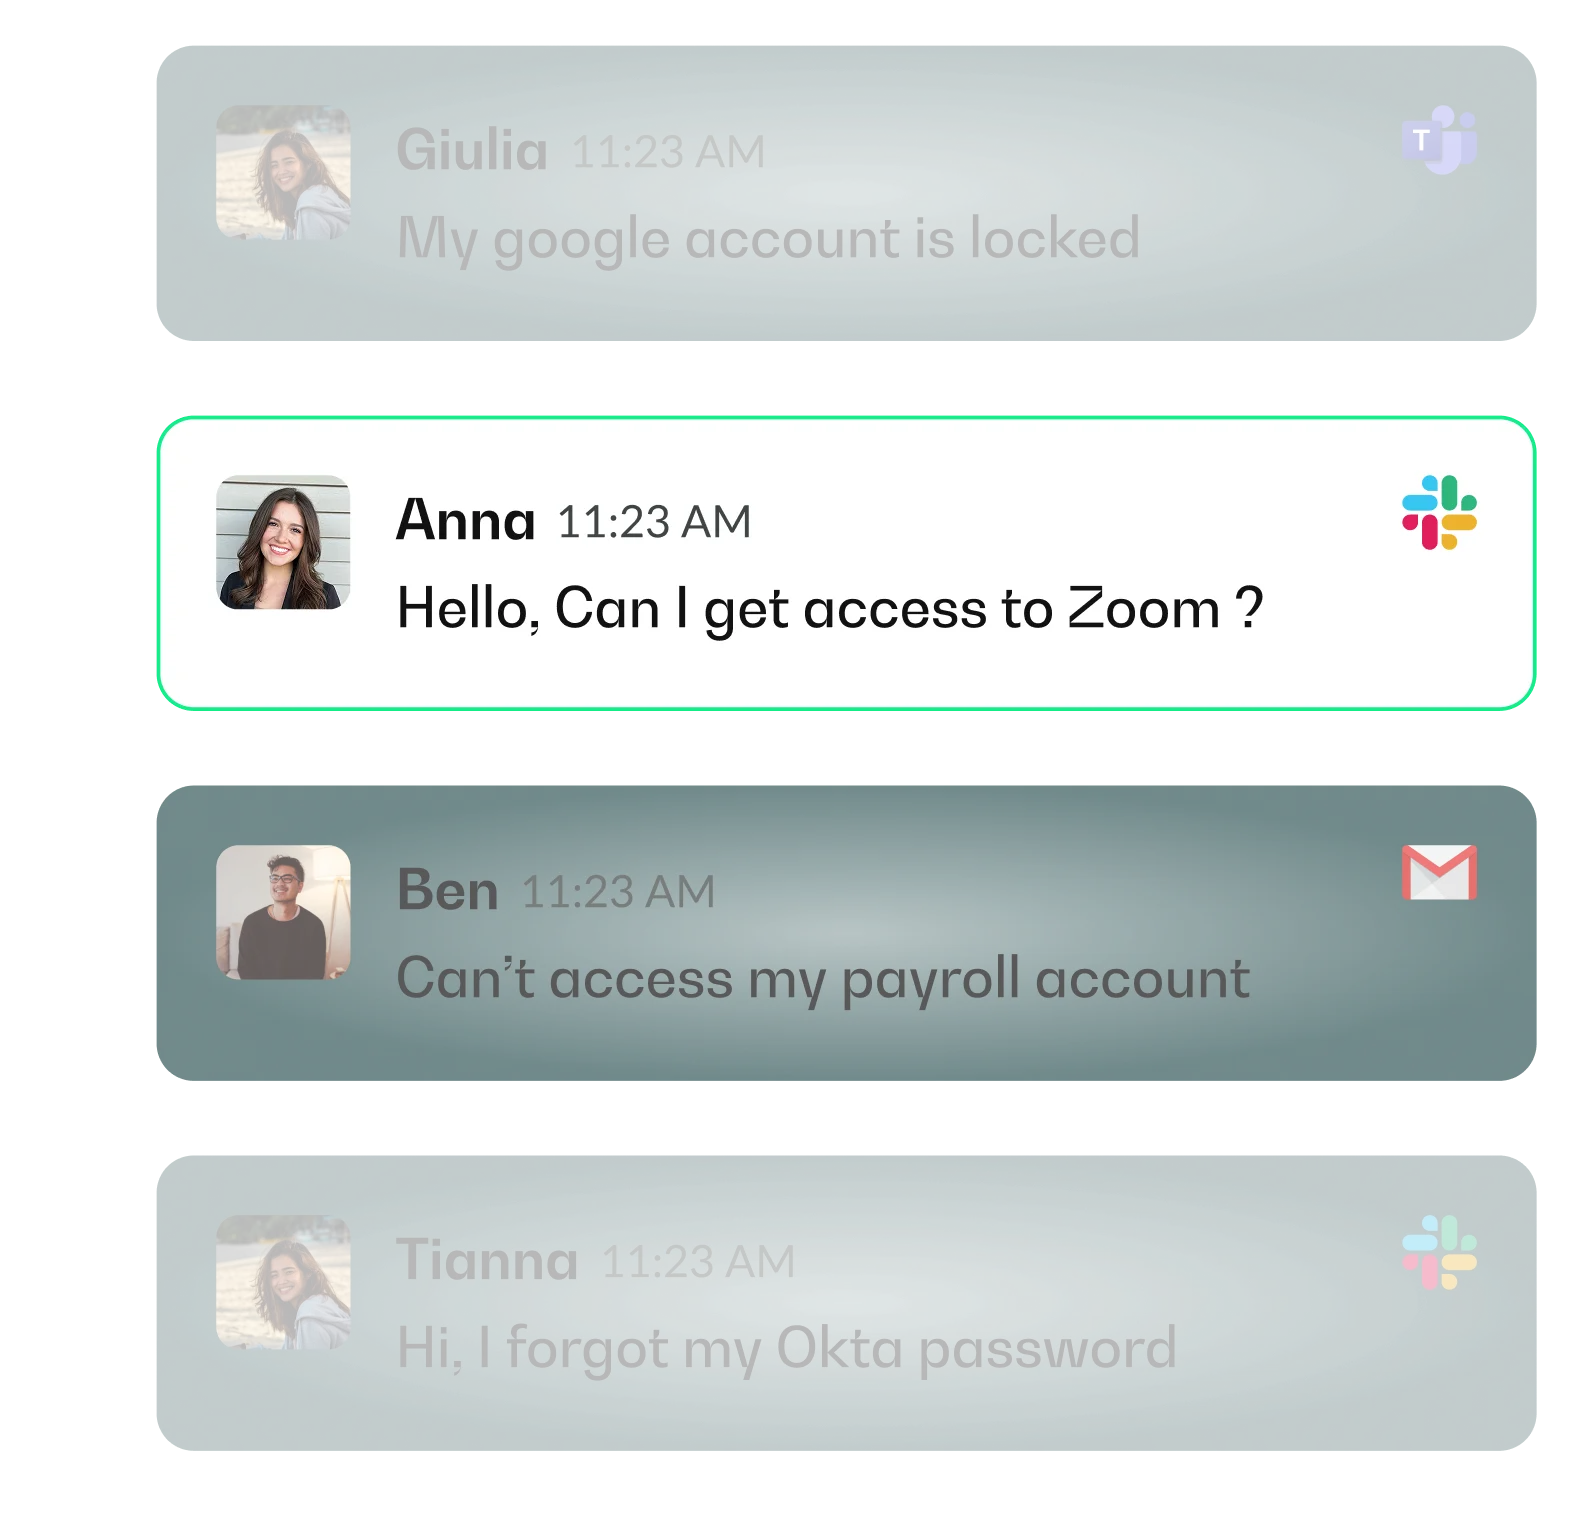
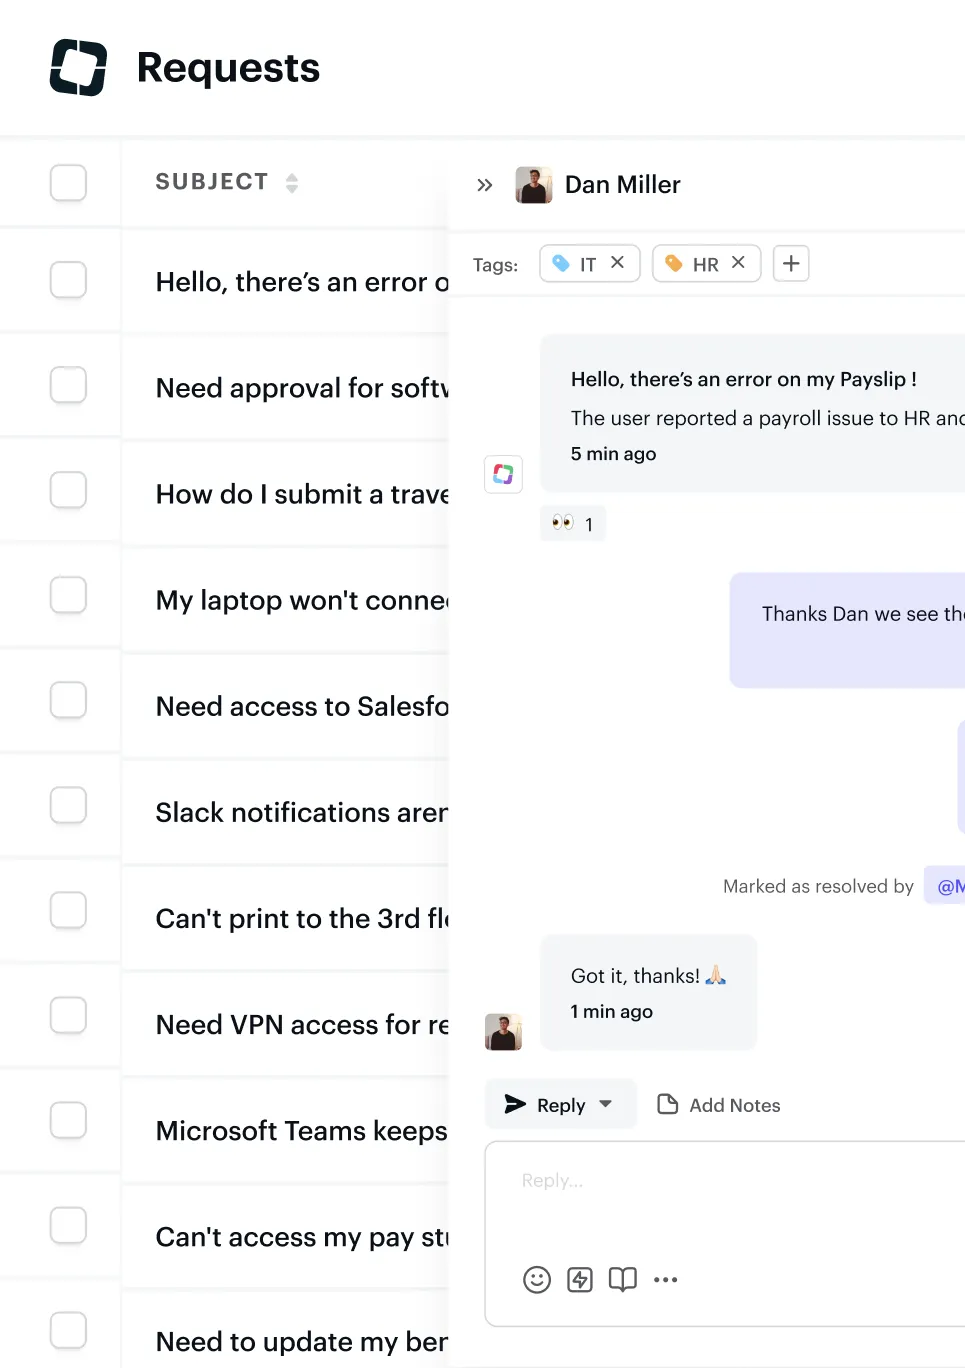
Omnichannel support
Requests from Slack, Teams, email, or portal flow into one unified inbox.
Human + AI for complex requests
When requests need human judgment, your team gets complete context and AI assistance.
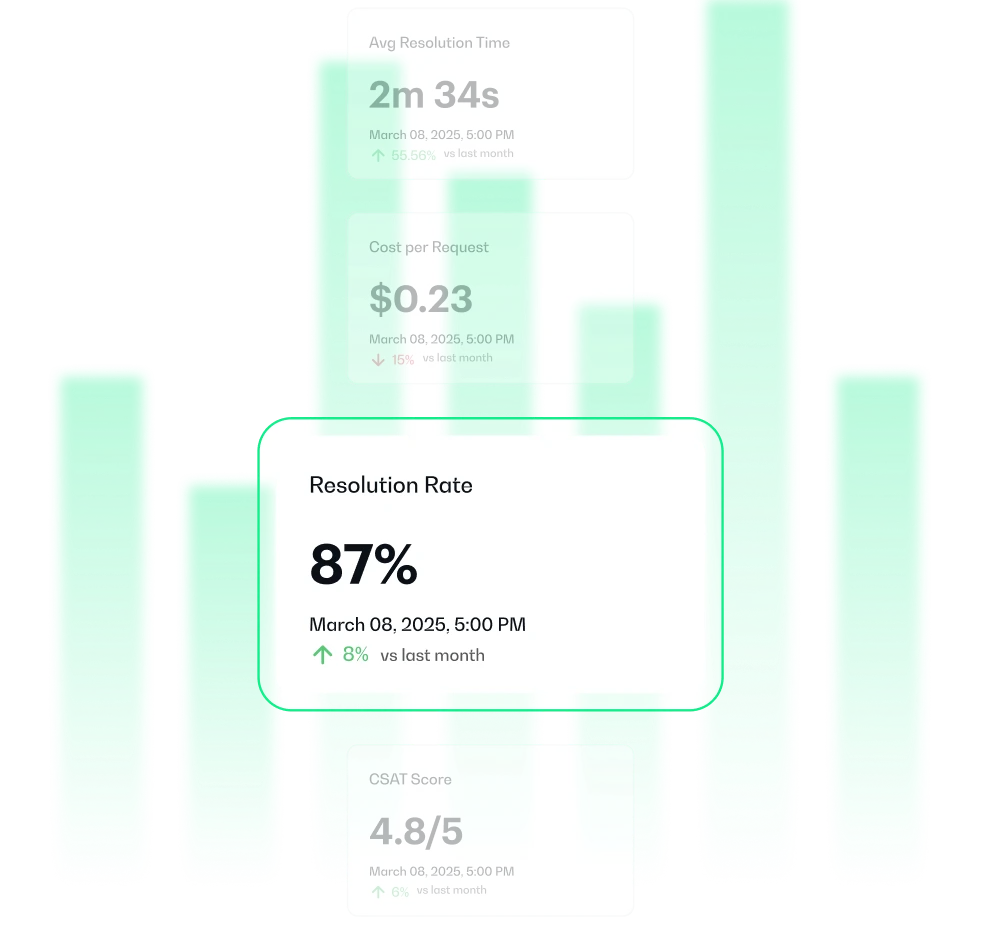
Complete visibility and control
Track resolution rates, costs, SLA performance, and bottlenecks in real-time.
.png)